
Research and Presentation

Visuals that tell the storyVisual imagery and word play to punctuate concepts.
|
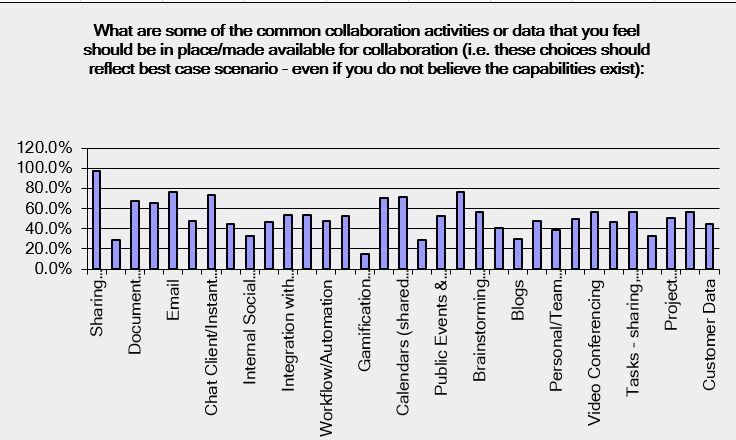
Open Data and AnalysisUsing data to help understand user context and analyze desired outcomes from the end user lens.
|
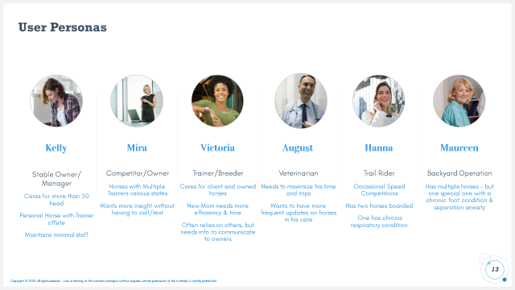
Simple, Straightforward ToolsCookbooks, Battlecards, Data Sheets, Workflows, Personas and Presentations that help define, strategize, design, develop, explain and show how outcomes were measured.
|
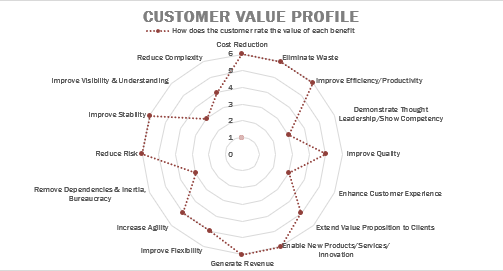
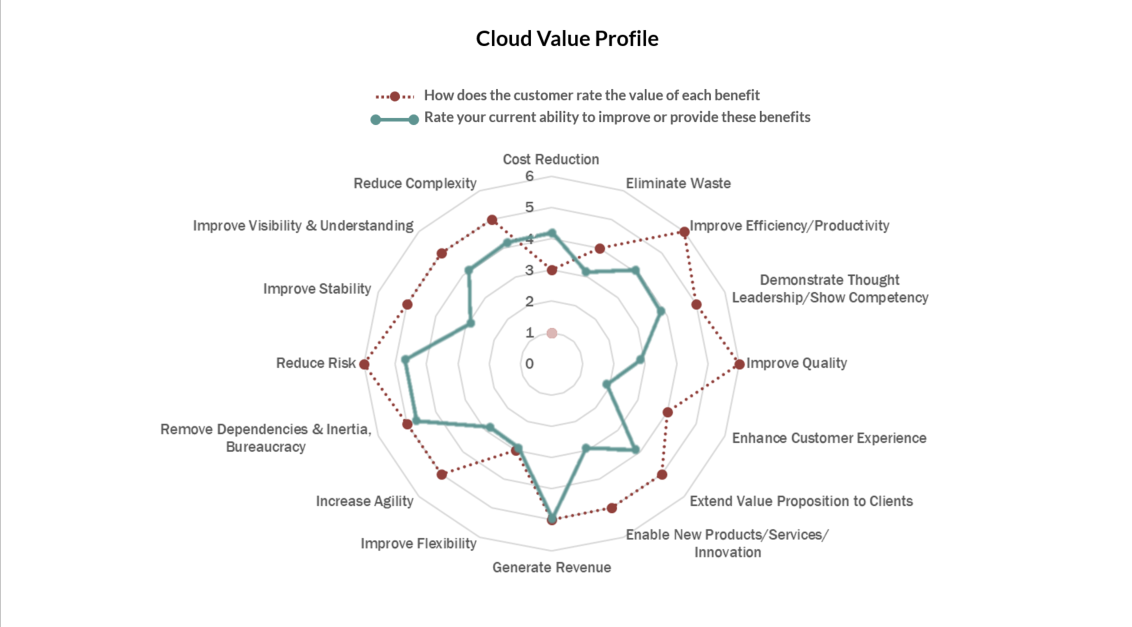
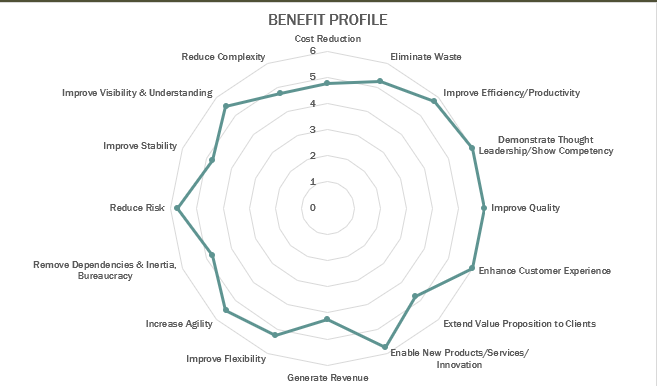
Value Profile
|
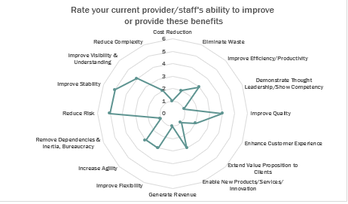
Desired State v. Current StateSimple tools to help customers define value, how they rate the current state against their desired benefits/value to understand gaps.
Solutions can be profiled for their ability to meet the desired value so that when overlaid on the current state it is clear how the solution increases value. |
|
What else is cookin'
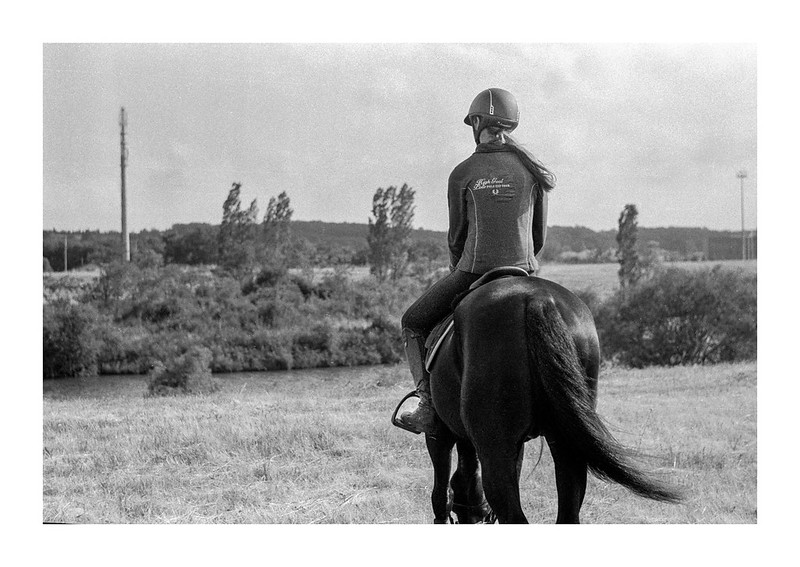
2Ride AgainNon-Profit that promotes sustainable practices by recycling equestrian products
|
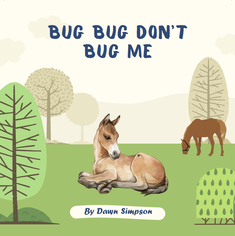
Arabian Literacy ProgramMy first published Children's book will be featured by the Arabian Literacy Program for young readers.
|
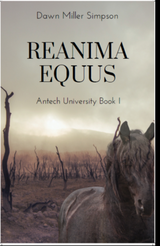
Reamina Equus - Book 1Seeking representation for the Antech University Books.
|
